Teacher's Overview
Summary
In this investigation, students test evaporation rates for different liquids. Next, students use a thermometer to measure the temperature change during evaporation.
Objective
Students will explore the energy change associated with evaporation and the differences in evaporation rates of different liquids.
Safety
- Be sure you and the students wear properly fitting goggles.
- Isopropyl alcohol and acetone are flammable and should be handled with care. Avoid flames or sparks, and work in a well-ventilated area. Avoid body tissue contact.
- Do not substitute plastic cups for glass beakers in this experiment, as acetone will dissolve some plastic cups.
Materials for Each Group
- 4 student thermometers
- 5 paper towels
- 4 small rubber bands
- Tape or sticky labels
- 3 droppers
- Water
- 99% isopropyl alcohol
- Acetone
- 3 small glass beakers (50–150 mL)
- 3 graduated cylinders (10–100 mL)
Time Required
One class period, approximately 45–50 minutes.
Lab Tips
Because water can take a long time to evaporate, you may wish to have students move on to the second part of the investigation after recording evaporation times for acetone and isopropyl alcohol. Note that evaporation times may vary according to humidity and air currents. Integrating into the Curriculum This investigation could be incorporated into a unit on phase changes, chemical and physical changes, and energy.
Student Investigation
In this activity, you will explore the energy change that accompanies the process of evaporation. Evaporation, like melting or freezing, is an example of a phase change—a change from one physical form of a substance to another.
During evaporation, energetic molecules leave the liquid phase, which lowers the average energy of the remaining liquid molecules. The remaining liquid molecules can then absorb energy from their surroundings. This process can take place at any temperature because some of the molecules in a liquid will always have enough energy to enter the gas phase.
Phase changes release or use energy because they bring particles closer together or cause them to move farther apart. To understand why these processes release or use energy, recall that all atoms or ions have at least some attraction for one another. Overcoming these attractions, as particles move farther apart, requires energy. When particles come back together, energy is released.
But are all attractions the same?
Intermolecular vs. Intramolecular Forces
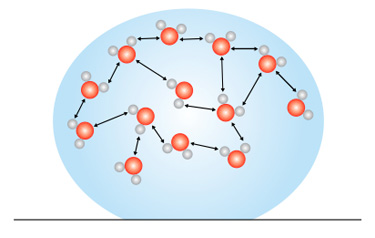
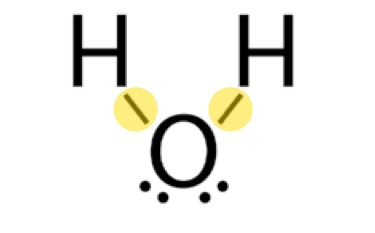
During a phase change, the attractive forces between whole molecules are disrupted or restored. These are called intermolecular forces. Conversely, during a chemical change, the bonds between atoms within a molecule or ion are disrupted or restored. These are called intramolecular forces.
Intermolecular forces
Hydrogen bonding between water molecules
Intramolecular forces
Covalent bonds between hydrogen and oxygen
The relative strength of the intermolecular forces of a substance determines how much energy is required for two molecules of that substance to move further apart. Substances with very strong intermolecular forces (like water) require a comparatively greater amount of energy to separate.
For example, a great deal of energy is needed to convert liquid water to water vapor because water molecules have a particularly strong form of intermolecular attraction called hydrogen bonding. The energy added to the liquid water has to be enough to overcome the attraction that individual water molecules have for one another. The molecules of other liquids, however, may not be as strongly attracted to one another as water molecules are, and therefore require less energy to vaporize.
Energy Diagrams
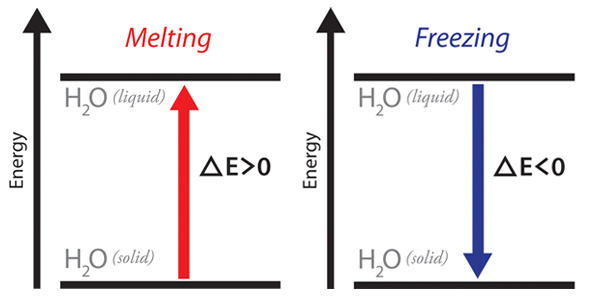
You can visualize the energy implications of phase changes using energy diagrams like the ones shown below. The horizontal lines represent the energies of substances in particular states. The higher horizontal line represents a substance in a physical state at a higher energy level, and the lower horizontal line represents a substance in a physical state at a lower energy level. Energy diagrams can help us keep track of energy differences even when we don’t have numeric values. The diagram on the left shows energy being absorbed by water molecules as it would be when ice melts to form liquid water. The energy diagram on the right shows energy being released from water molecules as it would be when liquid water freezes to form ice.
System and Surroundings
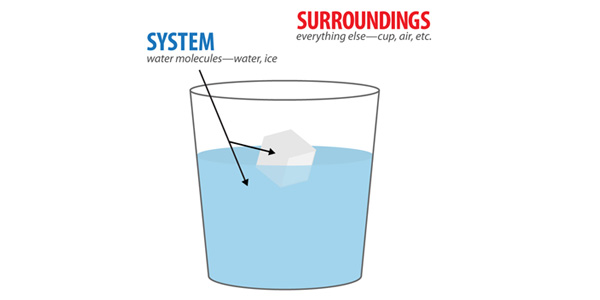
But where does the energy needed to melt ice come from? Where does the energy released as ice is formed go? Because we can’t create or destroy energy, we know that the surroundings play an important role in energy changes.
Energy may be absorbed from the surroundings to provide the energy needed to melt ice, or the surroundings may receive the energy released when water freezes. In the examples above, the surroundings can be defined as everything other than the water molecules involved in these phase changes. The water molecules are the system—the molecules we are studying. If these phase changes were taking place in a cup, even the cup would be considered the surroundings. So too would the air, the table the cup is sitting on, and even the rest of universe. Because we’re studying water molecules in this phase change, only the water molecules are part of the system.
Considering the surroundings also helps us to make sense of the sign convention for energy changes. When energy is absorbed by the system, ΔE is positive (+). When energy is released from the system, ΔE is negative (−).
In this investigation you will explore the energy change associated with evaporation and the differences in evaporation rates of different liquids.
Evaporation Test
- Fold a paper towel into thirds. When unfolded, the fold lines divide the towel into equal sections.
- Label the 3 sections of the paper towel “water,” “isopropyl alcohol,” and “acetone.” The sections should be at least 3–4 inches apart.
- Add 3 drops each of water, isopropyl alcohol, and acetone to the corresponding section othe paper towel.
- Record the evaporation time in minutes for each liquid in Table 1 below.
Energy Change During Evaporation
- Add 20-mL samples of water, isopropyl alcohol, and acetone into three small glass beakers labeled “water,” “isopropyl alcohol,” and “acetone.”
- Fold a paper towel along the long edge several times until it is 1 inch wide.
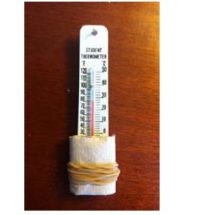
- Wrap the folded paper towel around the base of a thermometer, ensuring that it covers the bulb at the bottom, but doesn’t obscure numbers higher than 0 °C. Fasten the folded paper towel around the thermometer with a small rubber band.
- Prepare a total of four thermometers according to the procedure detailed in step 3. Label the 4 thermometers “water,” “isopropyl alcohol,” “acetone,” and “control” using tape or sticky labels.
- Record the initial temperature (Ti) for each thermometer in Table 2 below.
- With the help of a lab partner, dip the 3 thermometers labeled “water,” “isopropyl alcohol,” and “acetone” into the beakers containing the corresponding liquids so that the paper towels are moist but not dripping wet. Do not dip the control apparatus into any liquid.
- With a thermometer in each hand, gently swing the thermometer back and forth using a gentle pendulum motion for 2 minutes. Coordinate with your lab partner to use the same motion and intensity.
- After 2 minutes, record the final temperature (Tf ) in Table 2.
| Liquid | Water | Isopropyl alcohol | Acetone |
|---|---|---|---|
| Time (minutes) |
| Liquid | Ti | Tf | T | E (+/−) |
|---|---|---|---|---|
| 1. Water | ||||
| 2. Isopropyl alcohol | ||||
| 3. Acetone | ||||
| 4. Control |
Complete Table 2 using your observations from the experiment. Enter either a plus (+) or minus (−) sign in the last column of the table for the change in energy of the liquid dampened paper towel in each case.
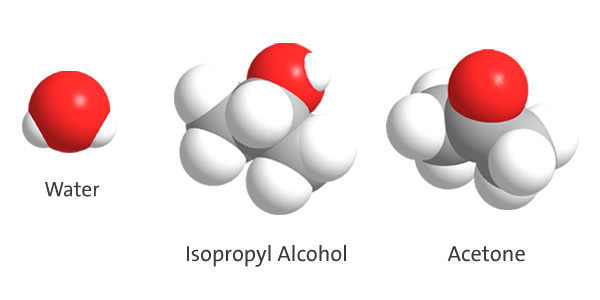
- Using the space-filling models below as a guide, write the chemical formulas for (1) water, (2) isopropyl alcohol, and (3) acetone.
- Using the language of intermolecular forces, explain the order of the evaporation rates you observed in the first part of your experiment.
- What differences in intermolecular forces might explain the differences in the time it takes water, isopropyl alcohol, and acetone to evaporate?
- Using the language of intermolecular forces and energy, explain why you observed the temperature changes that you did in the second part of your experiment. Refer to the energy diagrams in Preparing to Investigate to review sign conventions for phase changes.
- Draw and label energy diagrams for the evaporation of equal amounts (same number of moles) of water, acetone, and isopropyl alcohol. How are the energy diagrams different from one another?
- Is evaporation a cooling process or a heating process? Explain your answer in terms of energy and intermolecular forces.
- Given what you’ve learned in this investigation, why do you think people sweat?
- In this investigation, you have seen that evaporation is a cooling process. Condensation is the opposite of evaporation—water in the vapor phase condenses to form liquid water. Using the language of energy and intermolecular attraction, explain why condensation is considered a warming process. Draw an energy diagram for the process of condensation.

